Rest/Task fMRI
fMRI: Functional Magnetic Resonance Imaging
About: Rest
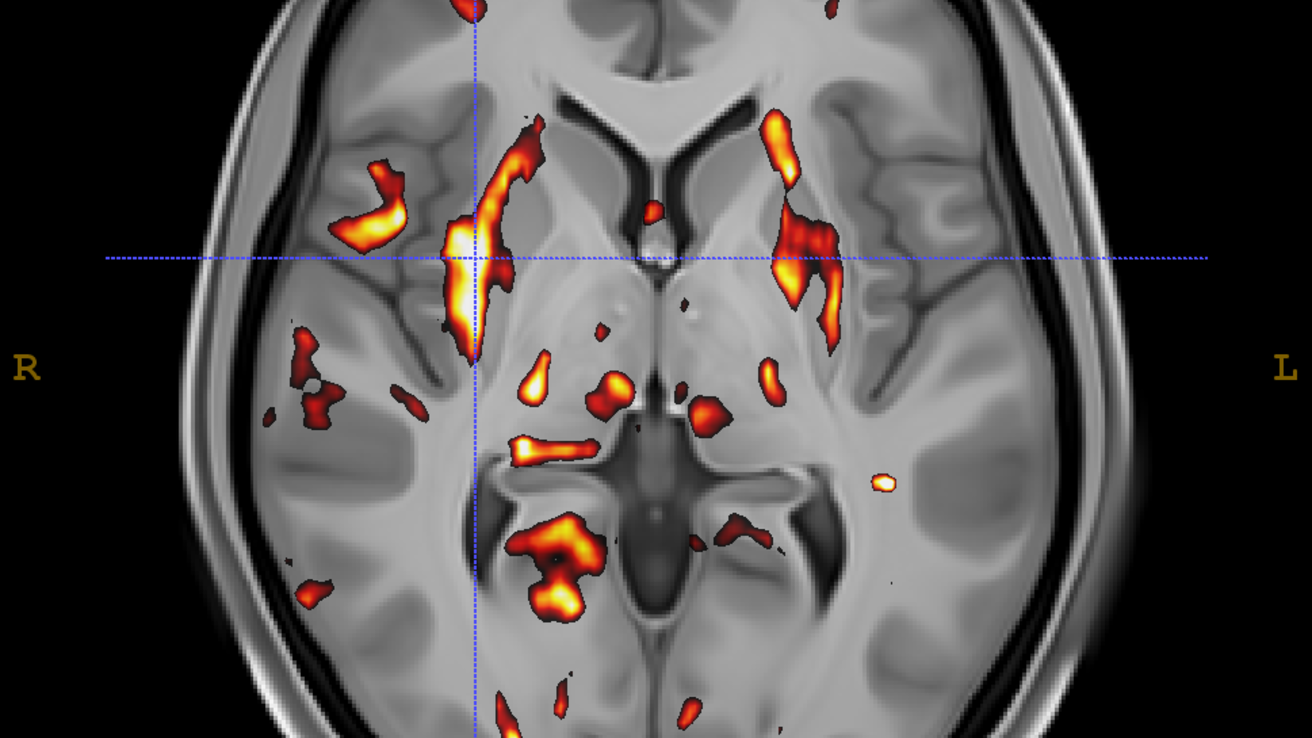
fMRI scans were preprocessed using standard tools from Advanced Normalization Tools (ANTs) version >= 2.1 [1], the FMRIB Software Library (FSL) version >= 6 [2], and Analysis of Functional NeuroImages (AFNI) version >= 18.0 [3]. Preprocessing steps included the following operations: (1) rician denoising; (2) motion correction; (3) non-brain voxel removal; (4) removal of white matter and cerebrospinal fluid signals; intensity normalization using 4D grand mean; (5) temporal filtering, bandpass signal filtering at .01 and .08 Hertz; and (6) registration to MNI standard space using the standard 3 step rigid-affine-syn algorithm implemented in ANTs. The resulting files were used to generate whole brain connectivity matrices; a predefined anatomical labelset was overlaid over the image and we calculated a Pearson's r value for each pair of regions.
About: Task
fMRI scans were preprocessed using Advanced Normalization Tools (ANTs) version >= 2.1 [1] and included the following operations: (1) rician denoising; (2) motion correction; (3) non-brain voxel removal; (4) removal of white matter and cerebrospinal fluid signals; intensity normalization using 4D grand mean; (5) temporal filtering, high pass signal filtering at .01 Hertz; and (6) registration to MNI standard space using the standard 3 step rigid-affine-syn algorithm implemented in ANTs. The resulting files were used as input into the AFNI tool 3dDeconvolution (18.0; [3]) and responses related to variables were extracted. These statistical maps were entered into contrasts of Experimental > Baseline, Experimental > Control, and Control > Baseline.
Citations
[1] Tustison, N. J., Cook, P. A., Klein, A., Song, G., Das, S. R., Duda, J. T., Kandel, B. M., van Strien, N., Stone, J. R., Gee, J. C., & Avants, B. B. (2014). Large-scale evaluation of ANTs and FreeSurfer cortical thickness measurements. NeuroImage, 99, 166–179.
[2] Jenkinson, M., Beckmann, C. F., Behrens, T. E., Woolrich, M. W., & Smith, S. M. (2012). FSL. NeuroImage, 62(2), 782–790.
[3] Robert W. Cox. AFNI: Software for Analysis and Visualization of Functional Magnetic Resonance Neuroimages,
Computers and Biomedical Research,Volume 29, Issue 3, 1996, Pages 162-173, ISSN 0010-4809.
BAW and FreeSurfer
BAW: BRAINSAutoWorkup pipeline
About
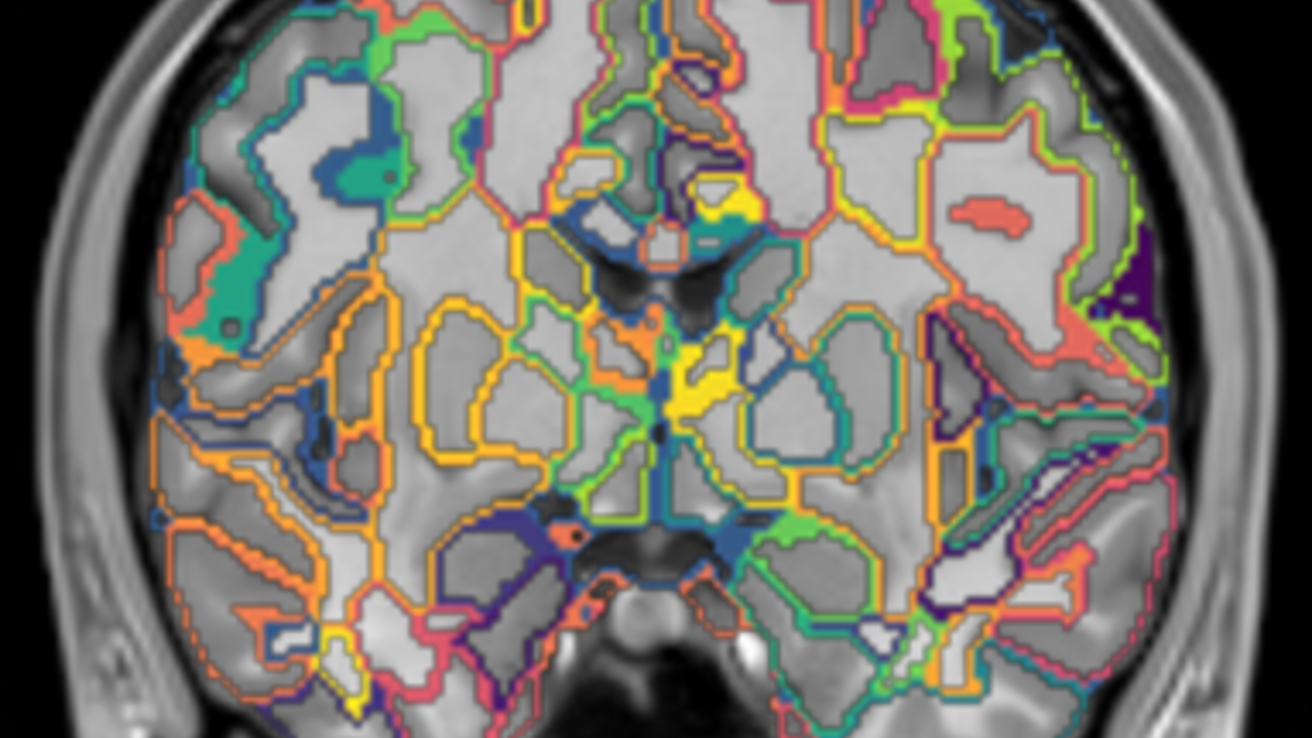
T1w and T2w images were processed using the BRAINSAutoWorkup pipeline which optimizes tissue classification through an iterative framework and produces robust parcellation of brain regions in a multi-site setting [1]. BRAINSAutoWorkup labels brain regions using a multi-atlas, similarity-weighted, majority-vote procedure (joint label fusion, [2]) using a set of expert-segmented templates adapted from the Desikan-Killiany atlas [3]. Brain regions include cortical and subcortical regions, separated by hemispheres and tissue type (gray or white matter) where appropriate. Cortical reconstruction and supplemental volumetric segmentation were also performed with the FreeSurfer image analysis suite [4-13].
Citations
[1] Pierson R, Johnson H, Harris G, Keefe H, Paulsen JS, Andreasen NC, Magnotta VA. Fully automated analysis using BRAINS: AutoWorkup. Neuroimage. 2011;54:328–36.
[2] Wang H, Suh JW, Das SR, Pluta JB, Craige C, Yushkevich PA. Multi-Atlas Segmentation with Joint Label Fusion. IEEE Trans Pattern Anal Mach Intell. 2013;35:611–23.
[3] Desikan RS, Ségonne F, Fischl B, et al. An automated labeling system for subdividing the human cerebral cortex on MRI scans into gyral based regions of interest. Neuroimage. 2006;31:968–80.
[4] Dale, A.M., Fischl, B., Sereno, M.I., 1999. Cortical surface-based analysis. I. Segmentation and surface reconstruction. Neuroimage 9, 179-194.
[5] Dale, A.M., Sereno, M.I., 1993. Improved localization of cortical activity by combining EEG and MEG with MRI cortical surface reconstruction: a linear approach. J Cogn Neurosci 5, 162-176.
[6] Desikan, R.S., Segonne, F., Fischl, B., Quinn, B.T., Dickerson, B.C., Blacker, D., Buckner, R.L., Dale, A.M., Maguire, R.P., Hyman, B.T., Albert, M.S., Killiany, R.J., 2006. An automated labeling system for subdividing the human cerebral cortex on MRI scans into gyral based regions of interest. Neuroimage 31, 968-980.
[7] Fischl, B., Dale, A.M., 2000. Measuring the thickness of the human cerebral cortex from magnetic resonance images. Proc Natl Acad Sci U S A 97, 11050-11055.
[8] Fischl, B., Liu, A., Dale, A.M., 2001. Automated manifold surgery: constructing geometrically accurate and topologically correct models of the human cerebral cortex. IEEE Trans Med Imaging 20, 70-80.
[9] Fischl, B., Salat, D.H., Busa, E., Albert, M., Dieterich, M., Haselgrove, C., van der Kouwe, A., Killiany, R., Kennedy, D., Klaveness, S., Montillo, A., Makris, N., Rosen, B., Dale, A.M., 2002. Whole brain segmentation: automated labeling of neuroanatomical structures in the human brain. Neuron 33, 341-355.
[10] Fischl, B., Salat, D.H., van der Kouwe, A.J., Makris, N., Segonne, F., Quinn, B.T., Dale, A.M., 2004a. Sequence-independent segmentation of magnetic resonance images. Neuroimage 23 Suppl 1, S69-84.
[11] Fischl, B., Sereno, M.I., Dale, A.M., 1999a. Cortical surface-based analysis. II: Inflation, flattening, and a surface-based coordinate system. Neuroimage 9, 195-207.
[12] Fischl, B., Sereno, M.I., Tootell, R.B., Dale, A.M., 1999b. High-resolution intersubject averaging and a coordinate system for the cortical surface. Hum Brain Mapp 8, 272-284.
[13] Fischl, B., van der Kouwe, A., Destrieux, C., Halgren, E., Segonne, F., Salat, D.H., Busa, E., Seidman, L.J., Goldstein, J., Kennedy, D., Caviness, V., Makris, N., Rosen, B., Dale, A.M., 2004b. Automatically parcellating the human cerebral cortex. Cereb Cortex 14, 11-22.
INPC Anatomical
INPC: Iowa Neuroimaging Processing Core
About
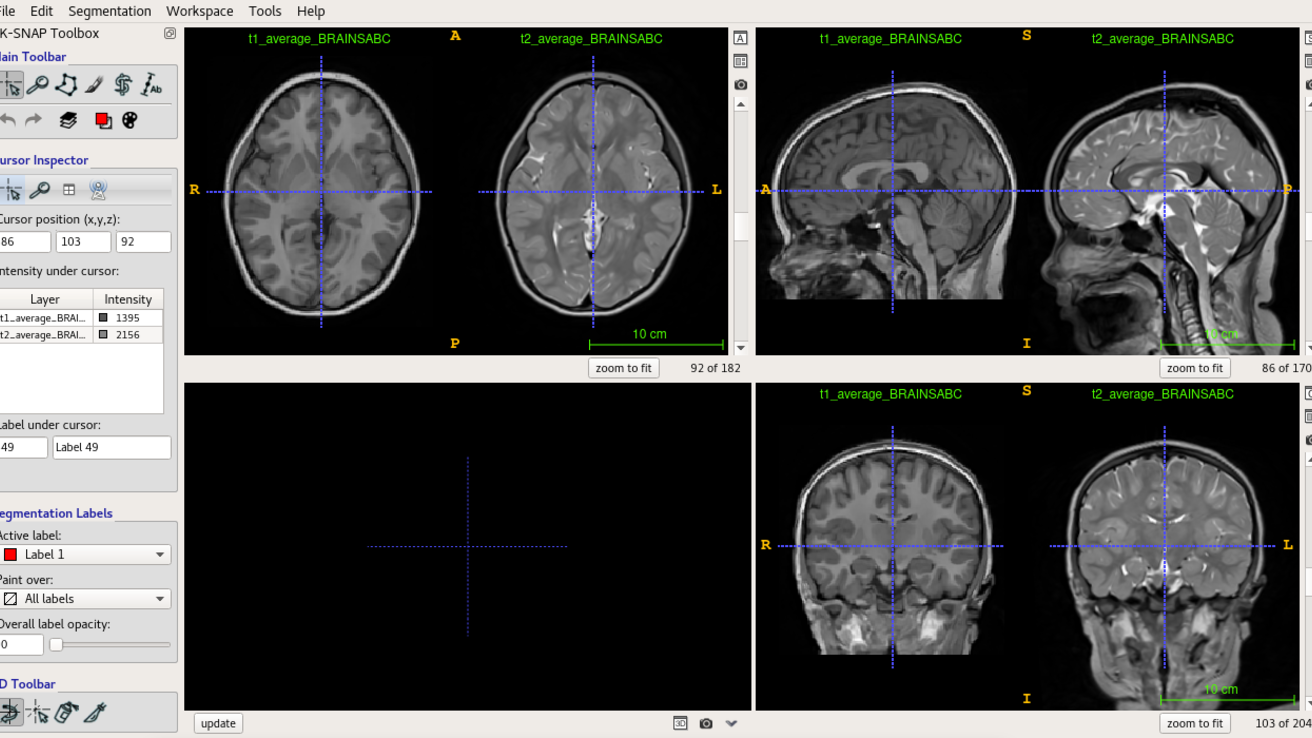
T2-weighted images for each subject were registered to their T1-weighted images, which were normalized to a standard space. All registrations consisted of rigid, affine, and nonlinear (symmetric normalization) components and were conducted using Advanced Normalization Tools [1]. All steps in the registration sequence were combined into a single transform and applied simultaneously to avoid compounding interpolation errors. Data were normalized to an unbiased average of the brains from the Human Connectome Project [2], which itself was normalized to ICBM 2009b Nonlinear Asymmetric space [3]. Images were denoised using Rician noise model in Advanced Normalization Tools software. Bias field inhomogeneity was corrected using the N4 algorithm implemented in Advanced Normalization Tools software.
Citations
[1] Avants BB, Tustison NJ, Song G, Cook PA, Klein A, Gee JC. A reproducible evaluation of ANTs similarity metric performance in brain image registration. Neuroimage. 2011;54(3):2033-44.
[2] Van Essen DC, Smith SM, Barch DM, Behrens TE, Yacoub E, Ugurbil K, Consortium W-MH. The WU-Minn Human Connectome Project: an overview. Neuroimage. 2013;80:62-79.
[3] Mazziotta J, Toga A, Evans A, Fox P, Lancaster J, Zilles K, et al. A probabilistic atlas and reference system for the human brain: International Consortium for Brain Mapping (ICBM). Philos Trans R Soc Lond B Biol Sci. 2001;356(1412):1293-322.
INPC Diffusion
INPC: Iowa Neuroimaging Processing Core

About
Diffusion-weighted images were processed using standard procedures of the FMRIB Diffusion toolbox from the FSL software package [1], where phase encoding distortion and eddy current artifacts were removed using top-up and eddy tools respectively [2,3]. Following correction, diffusion tensor models were generated using dtifit, and from these tensors, scalar measures, including fractional anisotropy, axial diffusivity and radial diffusivity, were calculated. B0 maps were co-registered to T2-weighted images for each subject, which were in turn registered to their T1-weighted images, which were normalized to a standard space. All registrations consisted of rigid, affine, and nonlinear (symmetric normalization) components and were conducted using Advanced Normalization Tools [4]. All steps in the registration sequence were combined into a single transform and applied simultaneously to scalar maps (FA, AD, RD) to avoid compounding interpolation errors. Data were normalized to an unbiased average of the brains from the Human Connectome Project [5], which itself was normalized to ICBM 2009b Nonlinear Asymmetric space [6].
Differences in regional WM was explored post-hoc, where mean values for each tract within the JHU DTI-based WM atlas [7,8] were extracted for each participant once diffusion scalars were in normalized, template space.
Citations
[1] M. Jenkinson, C.F. Beckmann, T.E. Behrens, M.W. Woolrich, S.M. Smith. FSL. NeuroImage, 62:782-90, 2012.
[2] Andersson JL, Skare S, Ashburner J. How to correct susceptibility distortions in spin-echo echo-planar images: application to diffusion tensor imaging. Neuroimage. 2003;20(2):870-88.
[3] Andersson JLR, Sotiropoulos SN. An integrated approach to correction for off-resonance effects and subject movement in diffusion MR imaging. Neuroimage. 2016;125:1063-78.
[4] Avants BB, Tustison NJ, Song G, Cook PA, Klein A, Gee JC. A reproducible evaluation of ANTs similarity metric performance in brain image registration. Neuroimage. 2011;54(3):2033-44.
[5] Van Essen DC, Smith SM, Barch DM, Behrens TE, Yacoub E, Ugurbil K, Consortium W-MH. The WU-Minn Human Connectome Project: an overview. Neuroimage. 2013;80:62-79.
[6] Mazziotta J, Toga A, Evans A, Fox P, Lancaster J, Zilles K, et al. A probabilistic atlas and reference system for the human brain: International Consortium for Brain Mapping (ICBM). Philos Trans R Soc Lond B Biol Sci. 2001;356(1412):1293-322.
[7] Wakana S, Caprihan A, Panzenboeck MM, Fallon JH, Perry M, Gollub RL, et al. Reproducibility of quantitative tractography methods applied to cerebral white matter. Neuroimage. 2007;36(3):630-44.
[8] Hua K, Zhang J, Wakana S, Jiang H, Li X, Reich DS, et al. Tract probability maps in stereotaxic spaces: analyses of white matter anatomy and tract-specific quantification. Neuroimage. 2008;39(1):336-47.
ASL
ASL: Arterial Spin Labeling
About
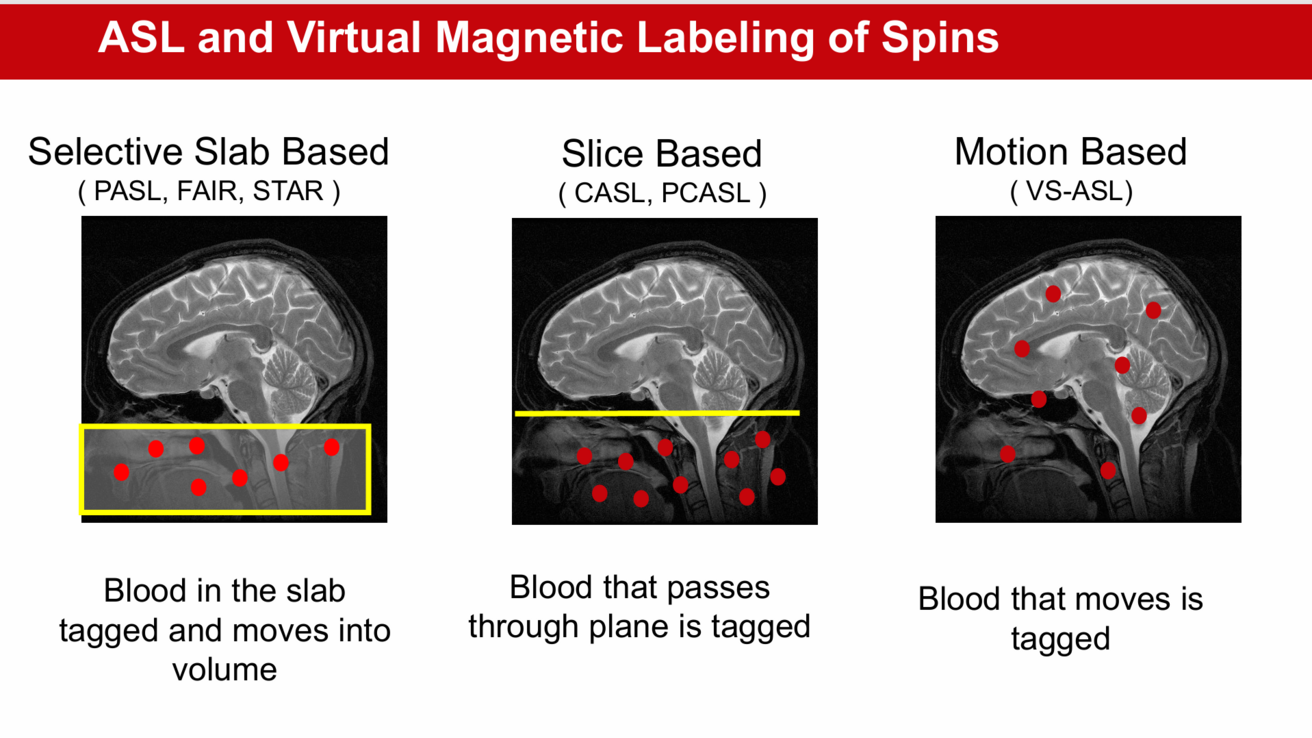
Arterial Spin Labeling (ASL) uses an adiabatic inversion pulse to magnetically tag water protons in arterial blood. The pulse inverts the magnetization of the protons, making them negatively magnetized. As these labeled protons flow into the brain, they mix with positively magnetized protons in stationary tissues, which causes a decrease in signal intensity, which can be measured to assess cerebral blood flow [1]. ASL uses ANTs and FSL software, which both perform registration on images.
Three different methods of ASL [2]:
- Selective Slab Based
- Tags blood in a specific region to study localized perfusion in the brain.
- Slice Based
- Applies a tagging plane at the base of the head, and the blood that passes through the brain is tagged.
- Most commonly used ASL technique for both clinical and neuroscience applications.
- Applies a tagging plane at the base of the head, and the blood that passes through the brain is tagged.
- Motion Based
- Tags blood based on the speed it travels, allowing for the labeling of a larger volume of blood.
Citations
[1] Jaganmohan, D., Pan, S., Kesavadas, C., & Thomas, B. (2021). A pictorial review of brain arterial spin labelling artefacts and their potential remedies in clinical studies. The neuroradiology journal, 34(3), 154–168. https://doi.org/10.1177/1971400920977031
[2] E.C. Wong , An Introduction to ASL Labeling Techniques. JMRI 2014. .Pg. 1-10.
QSM
QSM: Quantitative Susceptibility Mapping
About
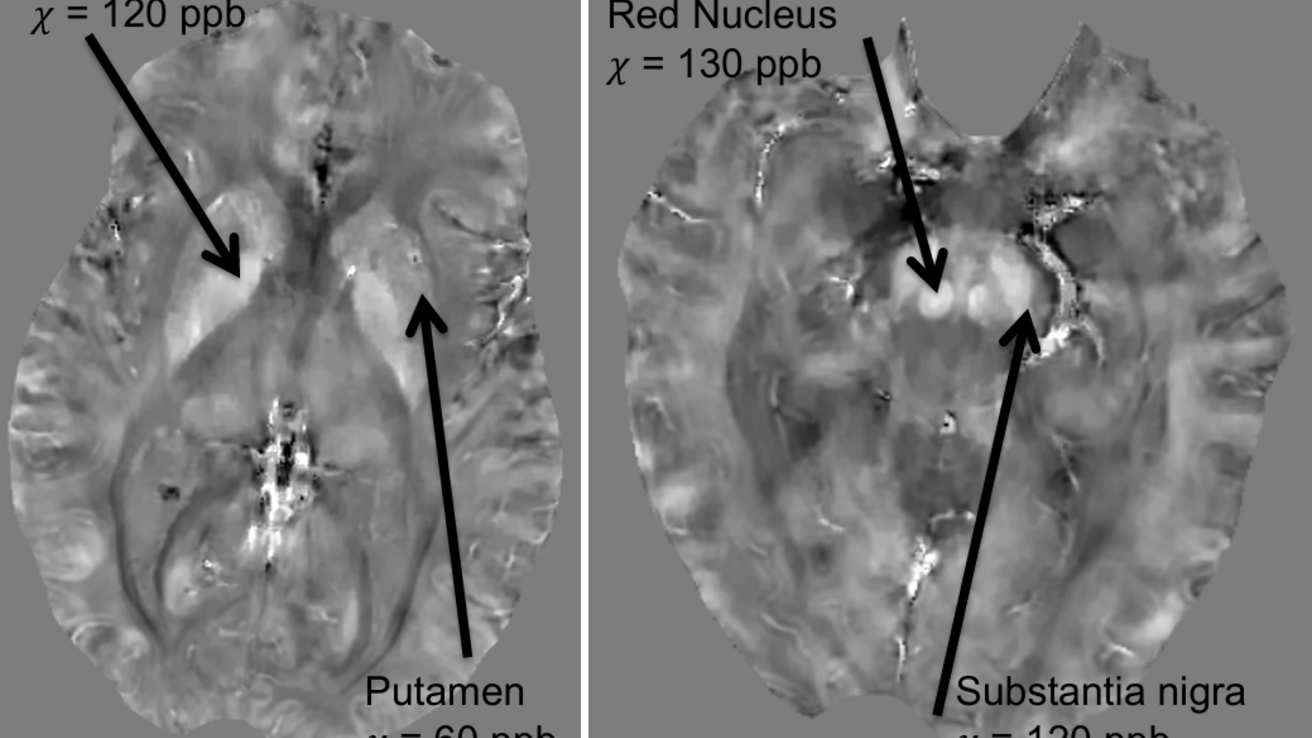
Quantitative Susceptibility Mapping (QSM) uses Gradient-Recalled Echo (GRE) MRI sequences to generate phase images, which reflect how different tissues respond to magnetic fields. Using the information from the phase image, QSM creates 3D images of tissue magnetic susceptibility [1]. Total Generalized Variation QSM (TGV-QSM) is used during reconstruction to improve image quality [2].
Citations
[1] Liu, C., Wei, H., Gong, N. J., Cronin, M., Dibb, R., & Decker, K. (2015). Quantitative Susceptibility Mapping: Contrast Mechanisms and Clinical Applications. Tomography (Ann Arbor, Mich.), 1(1), 3–17. https://doi.org/10.18383/j.tom.2015.00136
[2] Chatnuntawech, I., McDaniel, P., Cauley, S. F., Gagoski, B. A., Langkammer, C., Martin, A., Grant, P. E., Wald, L. L., Setsompop, K., Adalsteinsson, E., & Bilgic, B. (2017). Single-step quantitative susceptibility mapping with variational penalties. NMR in biomedicine, 30(4), 10.1002/nbm.3570. https://doi.org/10.1002/nbm.3570
MRS
MRS: Magnetic Resonance Spectroscopy
About
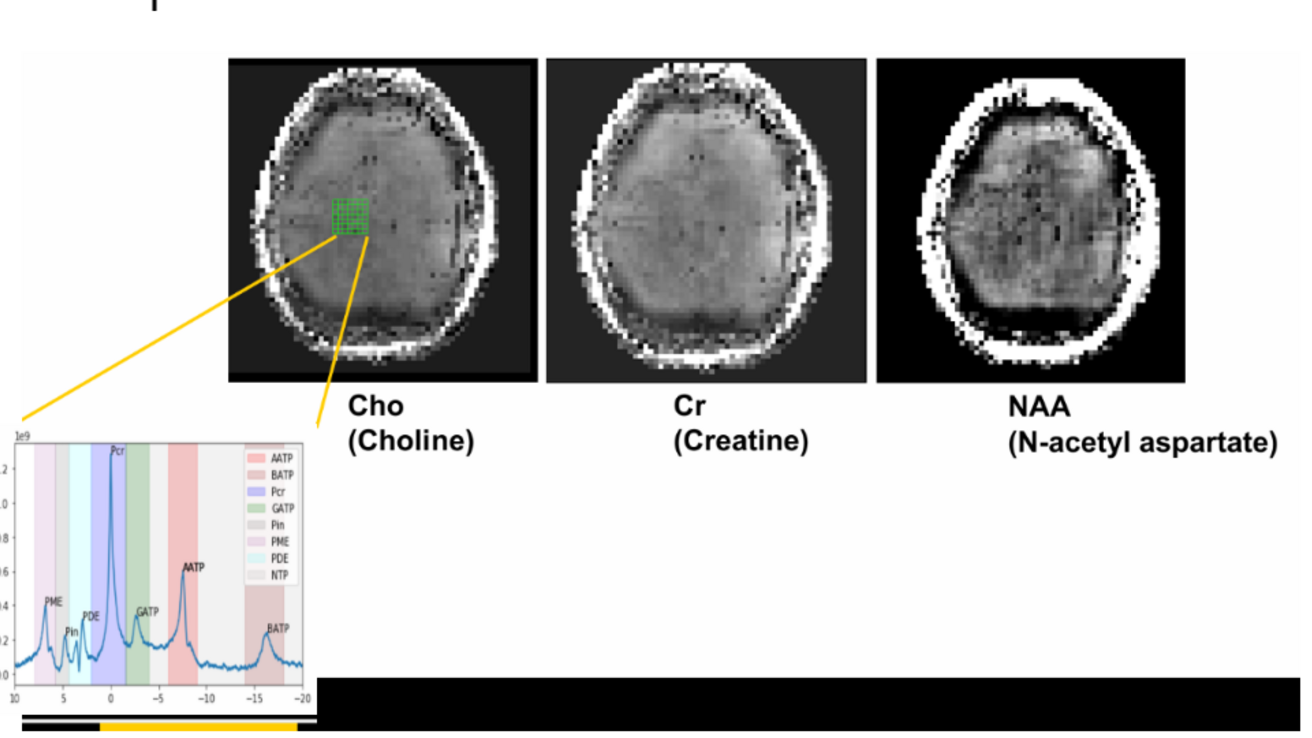
Odd-numbered isotopes possess a nuclear spin property, allowing them to behave like a magnetic dipole in the presence of a magnetic field. When these nuclei return to their relaxed state, they emit radiofrequency signals that can be detected via a spectrum graph [1]. The LCModel is then used as a reference point for MRS data by using in vitro metabolite solution [2].
Citations
[1]Tognarelli, J. M., Dawood, M., Shariff, M. I., Grover, V. P., Crossey, M. M., Cox, I. J., Taylor-Robinson, S. D., & McPhail, M. J. (2015). Magnetic Resonance Spectroscopy: Principles and Techniques: Lessons for Clinicians. Journal of clinical and experimental hepatology, 5(4), 320–328. https://doi.org/10.1016/j.jceh.2015.10.006
[2] Provencher, S. W. (1993). Estimation of metabolite concentrations from localized in vivo proton NMR spectra. Magnetic Resonance in Medicine, 30(6), 672–679. https://doi.org/10.1002/mrm.1910300604